
Markets don't announce their direction with a banner. You watch indexes climb for weeks, then wonder if you should invest more or prepare for a reversal. You see headlines about new highs and ask whether it's momentum or mania.
Bull marketA sustained stretch of rising prices, conventionally dated from a 20% recovery off the previous market low. indicators and bear marketA decline of 20% or more from a recent market high, and the stretch of falling prices that follows it. signs show up in price trends, market breadth, sector behavior, and investor positioning. Each signal matters, but none works in isolation. A single metric can mislead. A pattern across several tells you what the market is actually doing.
You'll learn which signals to track, how they cluster differently in bull and bear markets, and how to build a monitoring routine that helps you recognize conditions without pretending to predict the exact turn.
Price trends and momentum patterns
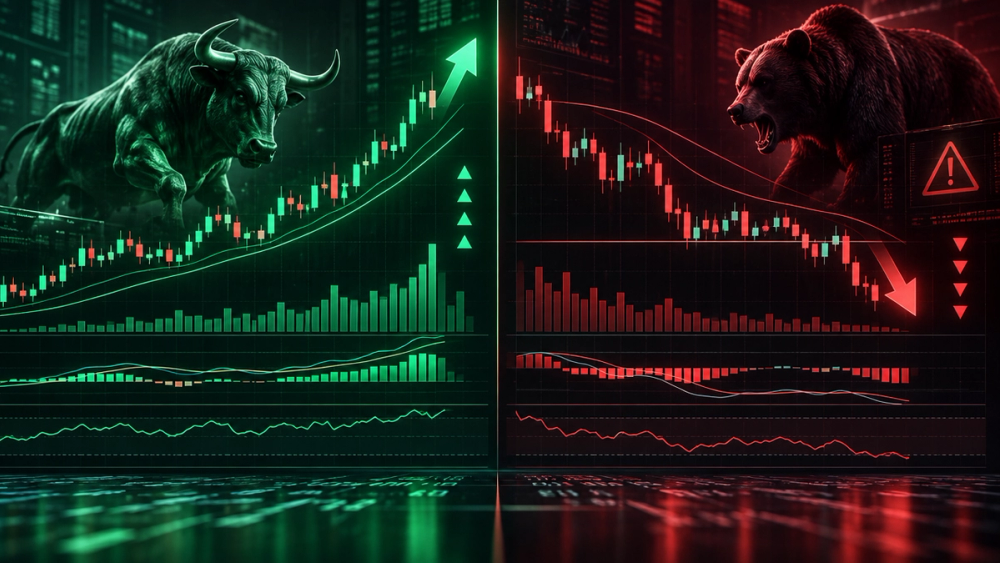
Bull markets create a staircase pattern of higher highs and higher lows. Each rally pushes prices above the previous peak, and each pullback stops above the prior low. This pattern can persist for months or years, signaling that buyers consistently outnumber sellers even during temporary corrections.
Bear markets reverse this structure. Prices form lower highs and lower lows as selling pressure dominates. Rallies fail to reach previous peaks, and each decline breaks through the last support level.
The 20% threshold is the standard marker for both phases. A 20% rise from a market bottom defines a bull market, while a 20% drop from a peak marks a bear market. This convention helps investors distinguish meaningful shifts from normal fluctuation.
Moving averages smooth out daily noise and reveal the underlying trend. When prices trade above the 50-day and 200-day moving averages, the market is typically in bull territory. Prices below both averages suggest a bear phase.
Short-term volatility does not invalidate the broader trend. A bull market can experience sharp one-week drops without becoming a bear market, just as brief rallies do not end a sustained downturn.
Market breadth and participation
Bull markets typically show broad participation, with the majority of stocks rising together across multiple sectors. When the S\&P 500 climbs, for example, you'll often see 70% or more of its components trading above their 200-day moving averages. Bear markets reveal the opposite: either narrow leadership where a handful of large stocks mask weakness elsewhere, or widespread declines affecting most holdings.
The advance-decline line tracks the number of stocks rising versus falling each day. When this line climbs alongside major indexes, participation is healthy. Divergence occurs when indexes reach new highs but the advance-decline line doesn't follow, suggesting fewer stocks are driving gains. This concentration often precedes corrections.
The new highs versus new lows ratio offers another breadth measure. Bull markets regularly produce more stocks hitting 52-week highs than lows. When new lows begin outnumbering new highs while indexes still drift upward, breadth is deteriorating.
Concentration risk emerges when a small group of stocks carries the entire index higher while most names stagnate or fall. This fragile structure can't sustain a bull market for long.
Sector rotation and leadership
Where money flows reveals how investors see the future. In bull markets, cyclical sectors like technology, consumer discretionary, and financials lead the way. These sectors depend on economic growth: tech needs corporate spending, discretionary retailers need confident consumers, and banks profit when borrowing accelerates. Strong performance here signals that investors expect expansion and are willing to take risk.
Bear markets flip this pattern. Money rotates into defensive sectors like utilities, consumer staples, and healthcare. People still need electricity, groceries, and medicine regardless of economic conditions, which makes these businesses stable when uncertainty rises. This rotation happens because investors prioritize preservation over growth when they expect trouble ahead.
Sector leadership often shifts before the broader market turns. If defensive sectors start outperforming while major indexes still climb, that divergence can signal weakening confidence. The reverse matters too: when cyclicals strengthen during a downturn, it may indicate that investors see the worst passing. Watching which sectors attract capital tells you whether the market's mood is turning cautious or optimistic before that shift becomes obvious in headline numbers.
Investor sentiment and positioning
Sentiment surveys quantify the collective mood of investors. The American Association of Individual Investors (AAII) polls its members weekly, asking whether they expect stocks to rise, fall, or stay flat over the next six months. When bullish responses exceed 50% for several consecutive weeks, markets often have limited upside left. Bear markets push bearish sentiment above 50%, sometimes reaching 60% or higher during capitulation phases.
The CNN Fear & Greed Index combines seven measures, including safe-haven demand and market momentum, into a single 0-100 score. Readings above 75 indicate extreme greed, common late in bull markets. Readings below 25 show extreme fear, typical during bear market lows.
The put-call ratio divides put option volume by call option volume. Ratios below 0.7 suggest excessive bullishness as traders pile into calls. Ratios above 1.2 indicate defensive positioning through put buying, often near market bottoms.
The VIX, derived from S\&P 500 option prices, measures expected volatility. Bull markets hold VIX below 20. Bear markets push it above 30, sometimes spiking past 40 during panic selling.
Economic fundamentals and earnings
Bull markets typically align with economic expansion. GDP grows at a steady pace, employers add jobs, and corporate earnings rise quarter after quarter. Companies report higher revenue and wider profit margins as consumer spending increases and business investment picks up. Analysts raise their forward earnings estimates, projecting continued growth over the next twelve months.
Bear markets coincide with economic contraction. GDP growth slows or turns negative during recessions. Unemployment rises as companies cut payrolls. Corporate earnings decline as revenue falls and costs eat into margins. Forward earnings estimates drop as analysts anticipate weaker performance ahead.
The relationship isn't perfectly synchronized. Markets are forward-looking and price in expectations months before economic data confirms the shift. Stock prices often peak before a recession officially begins and bottom before the economy stops contracting. A bull market can start while unemployment is still rising if investors believe the worst is over. Watch the direction of change in these fundamentals rather than waiting for perfect conditions.
Building a monitoring framework
No single indicator confirms a bull or bear market on its own. Markets send mixed signals regularly, so watching multiple data points together gives you a clearer picture than relying on any one metric.
A simple monthly checklist keeps you grounded in current conditions without pretending you can predict the next turn. Track four or five indicators: the S\&P 500's position relative to its 200-day moving average, the advance-decline line, new 52-week highs versus new lows, and a sentiment measure like the AAII survey. Record what each one shows, then look for agreement across the group.
Recognition is useful. Prediction is not. You can see that breadth is strong or that sentiment has turned pessimistic, but that does not tell you when the market will reverse. Focus on what the data shows now rather than forecasting the future.
When patterns shift, revisit the differences between bull and bear conditions (link to "Bull Market vs Bear Market: Key Differences Explained") and review how long these cycles typically run (link to "How Long Do Bull Markets Last? Historical Data and Patterns"). Context from history helps you interpret what you are seeing today.
Track multiple bull market indicators together, not separately
Bull market indicators work best when you watch several at once rather than relying on any single metric. Start by tracking price trends relative to moving averages and checking whether market breadth supports the move. Add sector performance and sentiment readings to confirm what the price action suggests. Review this set monthly, not daily, since market regimes change slowly and short-term noise creates false signals. Remember that these tools help you recognize the current environment, not predict when it will shift. Markets typically turn before the signals flip, so use bull market indicators to understand what is happening now and adjust your positioning accordingly rather than trying to time the next transition.