About this template
Net worth — everything you own minus everything you owe — is the clearest single measure of financial progress. Saving, investing and paying off debt all show up here.
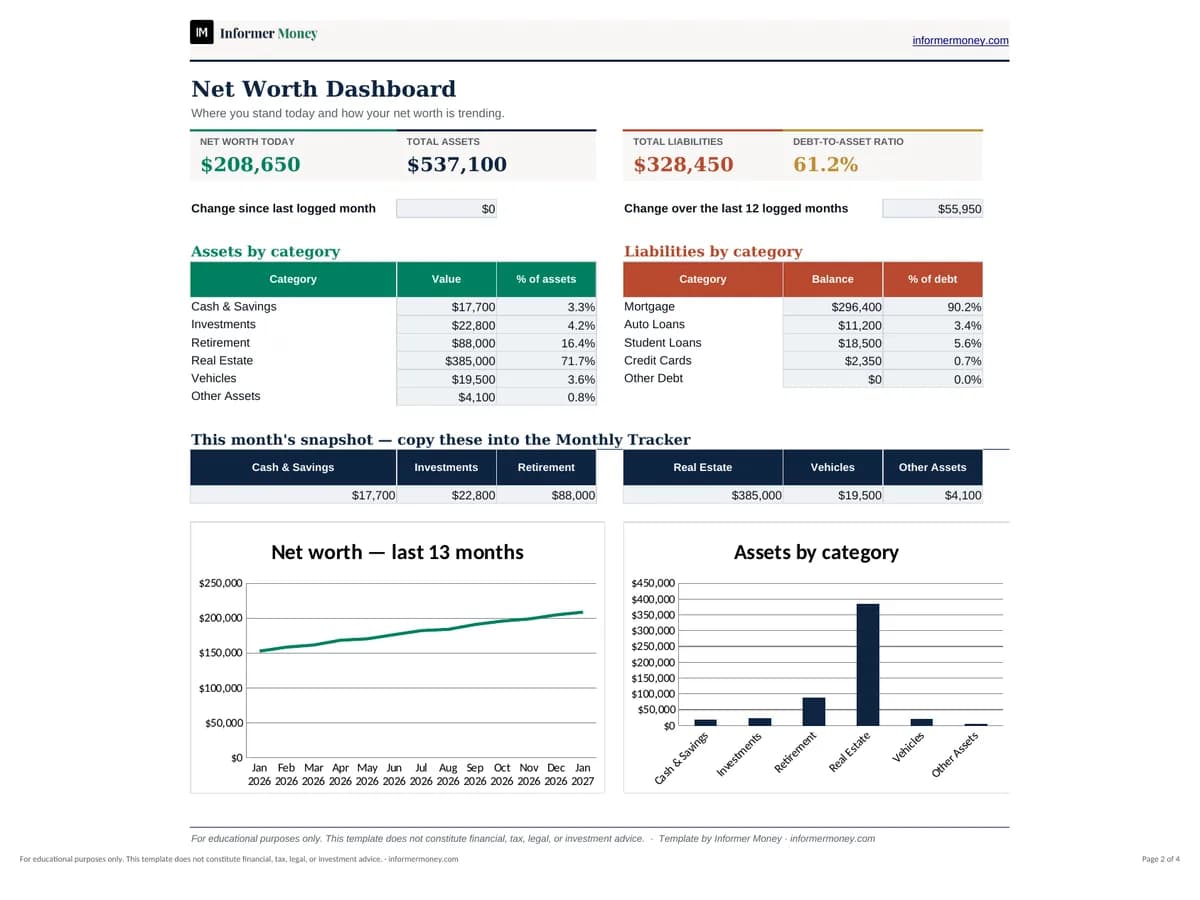
List your accounts, property and debts once, then log a snapshot each month. The dashboard totals everything by category, calculates your debt-to-asset ratio, and charts your net worth over the last 13 months so you can see the trend rather than the noise.
Who it's for
- Anyone who wants one number that sums up their finances
- Savers and investors tracking long-term progress
- Couples combining finances or planning big goals
What's included
- Assets & Debts register with category drop-downs (up to 15 assets and 10 debts)
- Dashboard with net worth, total assets, total liabilities and debt-to-asset ratio
- Breakdowns by category with percentage of total
- Monthly tracker with automatic totals and month-over-month change in $ and %
- Net-worth trend chart and an asset-mix chart
- 13 months of example history to show how it works
How to use it
- 1
On “Assets & Debts”, list your accounts and property with today’s values and pick a category for each.
- 2
Add every debt with its current balance and interest rate.
- 3
Review the Dashboard for your net worth and category breakdowns.
- 4
Each month, update values and copy the Dashboard’s snapshot row into the Monthly Tracker.
- 5
Delete the example history when you start logging your own.